Primavera P6 Professional offers numerous options for using Bar Labels in the Gantt chart. Some of the labels are predefined by Primavera P6 but there are also multiple ways to customize your own bars to when displaying activities in your Gantt chart. Here’s a closer look at how to do this.
To access Bars, click on ‘View Bar’. You can also click the ‘Layout Options Bar’ and choose ‘Bars’.
 Figure 1
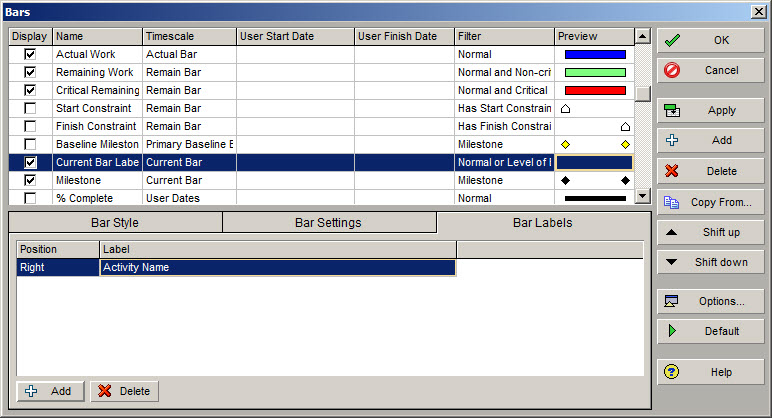
The first column allows you to display or hide the Bar, by toggling it on or off. The second column is the name of the Bar and, in this example, we are using ‘Current Bar’. The third column displays the Timescale which is available for each Bar
You can select Timescale option from a drop-down menu and the Timescale can be Remain Bar, Actual Bar, Current Bar, Early Bar, etc. The seventh column allows you to Preview the Bar, in our example, nothing is displayed for the ‘Current Bar Label’, as this will be applied to several Gantt chart objects.
Labeling bars
If we return to Figure 1, you will notice that there are three tabs ‘Bar Style’ ‘Bar Settings’ and ‘Bar Labels’.
- Select the Bar name. In our example this is ‘Current Bar Label’
- Click on the Bar Labels tab and select the + Add Button on the bottom left. This will allow you to add a Label to the respective Gantt chart object. By using the Position column, you can select the direction of the Label. In our example we have selected right, therefore our Label will be displayed to the right of the Gantt chart object.
- Select the Activity Name to display the name of the activity to the right of the Gantt chart object.
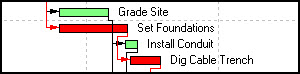
- Click the Apply button and the Gantt Chart Bars will be labelled as in Figure 2 below.
Figure 2
You can also display your Bar Label underneath the activity. Most schedulers do this when an activity has a long duration of 40 plus days. By using the Position button you can select Bottom-Center and the Label again will be the Activity Name.
Sometimes you may not be able to see the Activity Name when you click Apply as the row height is too low. You can easily correct this by selecting View, Table Font from the main drop down menu as displayed below in figure 3.
Figure 3
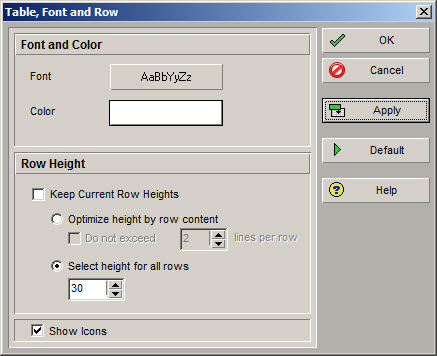
As you can see in our example, we have changed the row height to 30, but you can toggle to a height which is desirable for you and click Apply.
Figure 4
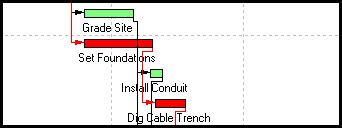
Your activity Labels should be displayed beneath the Bars as shown in Figure 4. In our example the durations are not very long, however when they are, Gantt Charts can appear much clearer.
Bar Customization
You can customize your Bar activities by selecting ‘Bar Style’ as shown in Figure 1. Under ‘Bar Style’ you can change the color of each activity so that your Gantt chart is personalized to your preference. For example, by changing the color or pattern you can distinguish different types of activities or activity groups from others.
The width of Bars can also be altered. The options are numerous as Primavera P6 activity Bar Labels show different activity types such as level of effort, milestone and task dependent. These Bars can then be displayed in your Gantt chart or hidden depending on your preference.
By hiding Bars, you can show different areas of the Gantt chart to different groups. For example, you may not need to display all of your Bar information to Stakeholders and Managers, just select the areas which they are interested in; whereas the whole project team may require more information.
Summary
Using Bar Labels in Primavera P6 give you a flexible tool which allows schedulers to create new Bar types. These can be used to show different activity types and activity status clearly. By customizing Bars for various activity groups, the scheduler has the option to display or hide the Bars depending on who is viewing the Gantt chart.
Bar Labels can be right-hand justified or for longer durations centered below the Bar. Often Bar Labels which are displayed below the Bar have to be increased in height so that the Activity Name can be viewed.